This is part one of a two-part series. Read part two here.
Sperm whales don’t sing melodious, moaning whale songs like their humpback cousins. The biggest predator on the planet communicates in clicks, called codas. Some compare the sounds to popping popcorn or frying bacon in a pan. For CUNY biologist David Gruber, it resembles “morse code or techno music.”
Gruber, the founding president of Project CETI, the Cetacean Translation Initiative, often listens for hours in his New York office to the sperm whale chats his team has recorded in the Eastern Caribbean.
Project CETI records sperm whale codas around the Eastern Caribbean island of Dominica. Courtesy of Project CETI
CETI focuses on sperm whales for several reasons. One reason is that it can build on the audio recordings that whale biologist Shane Gero has already been collecting for 15 years with the Dominica Sperm Whale Project. Gero was able to show that sperm whale families have different dialects, much like British and American English. “Another reason is that the sperm whale has been vilified as a killer, Moby Dick as a leviathan,” Gruber says. “Meanwhile it could be one of the most intelligent, sophisticated communicators on the planet.”
While the humpback whales sing their soprano songs primarily for mating, sperm whales are communicating to socialize and exchange information. CETI has already discovered that the communication patterns are complex. “Their codas are clicks, they are like ones and zeros, which is very good for cryptographers,” Gruber explains. “The combination of advanced machine learning and bioacoustics is slated to be the next microscope or telescope in terms of our ability to really listen more deeply and understand life at a new level.”
CETI’s team operates a giant whale-recording platform from a 40-foot sailboat off the coast of Dominica, a volcanic island in the Caribbean with a stable sperm whale population. Both by tagging the whales and installing whale listening stations with microphones dangling deep down into the ocean on floating buoys, CETI is recording several terabytes of data every month. The scientists are creating a three-dimensional interactive map of the whales within a 20-kilometer radius, combining sounds with data such as the whales’ heart rates.
By Robin Bender Ginn, Executive Director, OpenJS Foundation; and Omkhar Arasaratnam, General Manager, Open Source Security Foundation
The recent attempted XZ Utils backdoor (CVE-2024-3094) may not be an isolated incident as evidenced by a similar credible takeover attempt intercepted by the OpenJS Foundation, home to JavaScript projects used by billions of websites worldwide. The Open Source Security (OpenSSF) and OpenJS Foundations are calling all open source maintainers to be alert for social engineering takeover attempts, to recognize the early threat patterns emerging, and to take steps to protect their open source projects.
Failed Credible Takeover Attempt
The OpenJS Foundation Cross Project Council received a suspicious series of emails with similar messages, bearing different names and overlapping GitHub-associated emails. These emails implored OpenJS to take action to update one of its popular JavaScript projects to “address any critical vulnerabilities,” yet cited no specifics. The email author(s) wanted OpenJS to designate them as a new maintainer of the project despite having little prior involvement. This approach bears strong resemblance to the manner in which “Jia Tan” positioned themselves in the XZ/liblzma backdoor.
None of these individuals have been given privileged access to the OpenJS-hosted project. The project has security policies in place, including those outlined by the Foundation’s security working group.
The OpenJS team also recognized a similar suspicious pattern in two other popular JavaScript projects not hosted by its Foundation, and immediately flagged the potential security concerns to respective OpenJS leaders, and the Cybersecurity and Infrastructure Security Agency (CISA) within the United States Department of Homeland Security (DHS).
Open source projects always welcome contributions from anyone, anywhere, yet granting someone administrative access to the source code as a maintainer requires a higher level of earned trust, and it is not given away as a “quick fix” to any problem.
Together with the Linux Foundation, we want to raise awareness of this ongoing threat to all open source maintainers, and offer practical guidance and resources from our broad community of experts in security and open source.
Suspicious patterns in social engineering takeovers:
Friendly yet aggressive and persistent pursuit of maintainer or their hosted entity (foundation or company) by relatively unknown members of the community.
Request to be elevated to maintainer status by new or unknown persons.
Endorsement coming from other unknown members of the community who may also be using false identities, also known as “sock puppets.”
PRs containing blobs as artifacts.
For example, the XZ backdoor was a cleverly crafted file as part of the test suite that wasn’t human readable, as opposed to source code.
Intentionally obfuscated or difficult to understand source code.
Gradually escalating security issues.
For example, the XZ issue started off with a relatively innocuous replacement of safe_fprintf() with fprintf() to see who would notice.
Deviation from typical project compile, build, and deployment practices that could allow the insertion of external malicious payloads into blobs, zips, or other binary artifacts.
A false sense of urgency, especially if the implied urgency forces a maintainer to reduce the thoroughness of a review or bypass a control.
These social engineering attacks are exploiting the sense of duty that maintainers have with their project and community in order to manipulate them. Pay attention to how interactions make you feel. Interactions that create self-doubt, feelings of inadequacy, of not doing enough for the project, etc. might be part of a social engineering attack.
Social engineering attacks like the ones we have witnessed with XZ/liblzma were successfully averted by the OpenJS community. These types of attacks are difficult to detect or protect against programmatically as they prey on a violation of trust through social engineering. In the short term, clearly and transparently sharing suspicious activity like those we mentioned above will help other communities stay vigilant. Ensuring our maintainers are well supported is the primary deterrent we have against these social engineering attacks.
Steps to help secure your open source project:
In addition to these recommendations, there are a number of security best practices that can improve the security properties of our projects. While these recommendations will not thwart a persistent social engineering attack, they may help improve your overall security posture of your project.
Consider following industry-standard security best practices such as OpenSSF Guides.
Use strong authentication.
Enable two-factor authentication (2FA) or Multifactor Authentication (MFA).
Use a secure password manager.
Preserve your recovery codes in a safe, preferably offline place.
Do not reuse credentials/passwords across different services.
Steps for industry and government to help secure critical open source infrastructure:
The pressure to sustain a stable and secure open source project creates pressure on maintainers. For example,many projects in theJavaScript ecosystem are maintained by small teams or single developers who are overwhelmed by commercial companies who depend on these community-led projects yet contribute very little back.
To solve a problem of this scale, we need vast resources and public/private international coordination. There is already great work underway by the following organizations:
Open source foundations:
The Linux Foundation family of foundations and other similar organizations like ours can help provide a safety net for open source projects. Maintainers often lack the time, people and expertise in areas such as security. Neutral foundations help support the business, marketing, legal and operations behind hundreds of open source projects that so many rely upon. Our goal is to remove any friction outside of coding to support our maintainers and help their projects grow. As vendor-neutral nonprofits, we are uniquely positioned to offer expertise garnered from multiple stakeholders represented in our organizations.
On security, our open source foundations have found that an effective best approach is to provide technical assistance and direct support to open source projects.
Alpha-Omega is an associated project of the OpenSSF, funded by Microsoft, Google, and Amazon, funds critical projects and ecosystems. The project aims to build a world where critical open source projects are secure and where security vulnerabilities are found and fixed quickly. The OpenJS Foundation has experienced how funding developers for security has had a proven impact through Alpha-Omega investments in Node.js and jQuery.
Sovereign Tech Fund:
The Sovereign Tech Fund, financed by the German Federal Ministry for Economic Affairs and Climate Action, is providing the OpenJS Foundation and more open source organizations significant funding to strengthen infrastructure and security.
They have built a model with detailed reporting and accountability of resources, yet at the same time, have technical expertise on staff to customize security proposals for the variety of open source projects they fund.
It’s encouraging to see the German government taking this initiative to improve the lives of citizens by investing in critical open source infrastructure through the Sovereign Tech Fund.
We are advocating for more global public investment in initiatives like the Sovereign Tech Fund to invest in open source global that society depends on, complimentary to private funding. We recommend that public institutions learn from, adapt and coordinate with Germany’s Sovereign Tech Fund to support our interconnected open source projects and shared digital economies.
About OpenJS Foundation
The OpenJS Foundation is committed to supporting the healthy growth of the JavaScript ecosystem and web technologies by providing a neutral organization to host and sustain projects, as well as collaboratively fund activities for the benefit of the community at large. The OpenJS Foundation is made up of 35 open source JavaScript projects including Appium, Electron, Jest, jQuery, Node.js, and webpack and is supported by corporate and end-user members, including GoDaddy, Google, HeroDevs, IBM, Joyent, Microsoft, and the Sovereign Tech Fund. These members recognize the interconnected nature of the JavaScript ecosystem and the importance of providing a central home for projects which represent significant shared value.
About the OpenSSF
The Open Source Security Foundation (OpenSSF) is a cross-industry initiative by the Linux Foundation that brings together the industry’s most important open source security initiatives and the individuals and companies that support them. The OpenSSF is committed to collaboration and working both upstream and with existing communities to advance open source security for all. For more information, please visit us at <a href="http://openssf.org" rel="nofollow">openssf.org</a>.
About the Authors
Robin Bender Ginn is the Executive Director of the OpenJS Foundation, the neutral home to drive broad adoption and ongoing development of key JavaScript and web technologies. She also serves on the leadership team at the Linux Foundation. Robin has led major initiatives advancing open source technologies, community development, and open standards. Previously, Robin spent more than 10 years at Microsoft where she was at the forefront of the company’s shift to openness.
Omkhar Arasaratnam is the General Manager of the Open Source Security Foundation (OpenSSF). He is a veteran cybersecurity and technical risk management executive with more than 25 years of experience leading global organizations. Omkhar began his career as a strong supporter of open source software as a PPC64 maintainer for Gentoo and contributor to the Linux kernel, and that enthusiasm for OSS continues today. Before joining the OpenSSF, he led security and engineering organizations at financial and technology institutions, such as Google, JPMorgan Chase, Credit Suisse, Deutsche Bank, TD Bank Group, and IBM. As a seasoned technology leader, he has revolutionized the effectiveness of secure software engineering, compliance, and cybersecurity controls. He is also an accomplished author and has led contributions to many international standards. Omkhar is also a NYU Cyber Fellow Advisory Council member and a Senior Fellow with the NYU Center for Cybersecurity where he guest lectures Applied Cryptography.
A "rapid and far-reaching change" is necessary to prevent catastrophic climate change, according to the Intergovernmental Panel on Climate Change (IPCC). "However, the transformation of the economy towards climate neutrality always involves a certain amount of economic stress—some industries and jobs disappear while others are created," explains Johannes Stangl from the Complexity Science Hub (CSH). When it comes to climate policy measures, how can economic damage be minimized?
A CSH team has developed a new method to help solve this problem. "To understand how climate policy measures will affect a country's economy, it's not sufficient to have data on carbon dioxide emissions. We must also understand the role that companies play in the economy," says Stangl, one of the co-authors of the study published in Nature Sustainability.
CO2 emissions reduced by 20%
The researchers used a data set from Hungary that includes almost 250,000 companies and over one million supplier relationships, virtually representing the entire Hungarian economy. They examined what a country's entire economy would look like if certain companies were forced to cease production in various scenarios—all aimed at reducing greenhouse gas emissions by 20%.
"In the first scenario, we looked at what would happen if only CO2 emissions were taken into account," explains Stefan Thurner from the CSH. In order to reduce greenhouse gas emissions by 20%, the country's seven largest emitters would have to cease operations.
"In the meantime, however, around 29% of jobs and 32% of the country's economic output would be lost. The idea is completely unrealistic; no politician would ever attempt such a thing," says Thurner.
Furthermore, when greenhouse gas emissions and the size of the companies are considered, serious economic consequences result.
A two-factor approach
"Two factors are crucial—the CO2 emissions of a company, as well as what systemic risks are associated with it, i.e. what role the company plays in the supply network," explains Stangl. CSH researchers developed the Economic Systemic Risk Index (ESRI) in an earlier study. It estimates the economic loss that would result if a company ceased production.
Taking these two factors into account—a company's greenhouse gas emissions and its risk index for the country's economy—the researchers calculated a new ranking of companies with large emissions relative to their economic impact.
According to the new ranking, a 20% reduction in CO2 emissions would require the top 23 companies on the list to cease operations. This, however, would only result in a loss of 2% of jobs and 2% of economic output.
At the company level
"In reality, companies would naturally try to find new suppliers and customers. We want to take this aspect into account in a further developed version of our model in order to obtain an even more comprehensive picture of the green transformation. However, our study clearly shows that we need to take the supply network at the company level into account if we want to evaluate what a particular climate policy will achieve," say the authors of the study. This is the only way to assess which companies will be affected by a particular measure and how this will affect their trading partners, according to them.
The availability of company-level data has been largely lacking in Austria. The risk assessment is normally done at the sector level, for example, how severely a measure affects the entire automotive or tourism industry.
"This puts us at a disadvantage compared to other countries such as Hungary, Spain or Belgium, where detailed data is available at company level. In these countries, VAT is not recorded cumulatively, but in a standardized way for all business-to-business transactions, which means that extensive information is available on the country's supply network," explains Thurner.
More information: Firm-level supply chains to minimize decarbonization unemployment and economic losses, Nature Sustainability (2024). DOI: 10.1038/s41893-024-01321-x
Citation: Reducing CO₂ emissions by 20% with only a 2% economic loss (2024, April 15) retrieved 15 April 2024 from <a href="https://phys.org/news/2024-04-emissions-economic-loss.html" rel="nofollow">https://phys.org/news/2024-04-emissions-economic-loss.html</a>
This document is subject to copyright. Apart from any fair dealing for the purpose of private study or research, no part may be reproduced without the written permission. The content is provided for information purposes only.
The two most important things about speed cameras are that they save lives and that they are annoying. People think life-saving is good. They also think getting tickets is bad. These two beliefs are dissonant. Social psychology tells us that people will naturally seek to reconcile dissonant beliefs.
There are lots of ways to do this, some easier than others. For speed cameras, it typically means constructing a rationale for why cameras don’t really save lives or why life-saving initiatives aren’t admirable. A common approach is to claim that municipalities are motivated by ticket revenue, not safety, when implementing automated traffic enforcement (ATE). This implies that cameras’ safety benefits might be overstated, and that ATE proponents are behaving selfishly. Most people understand that this is transparently self-serving bullshit. It’s not really interesting enough to write about.
But there’s another dissonance-resolving strategy that popped into my feed recently that merits a response: what if speed cameras are racist?
This strategy doesn’t attempt to dismiss the safety rationale. Instead, it subordinates it. Sure, this intervention might save lives, the thinking goes, but it is immoral and other (unspecified, unimplemented) approaches to life-saving ought to be preferred.
I appreciate the work that the DC Policy Center does. Full disclosure: I’ve even cited this study approvingly in the past (albeit on a limited basis). But this tweet makes me worry that their work is transmuting into a factoid that is used to delegitimize ATE. I think that would be unfortunate.
So let’s look at this more closely. We can understand the study and its limitations. And, because DC publishes very detailed traffic citation data, we can examine the question of camera placement and citation issuance for ourselves–including from an equity perspective–and come to an understanding of what’s actually going on.
What does the DCPC study SHOW?
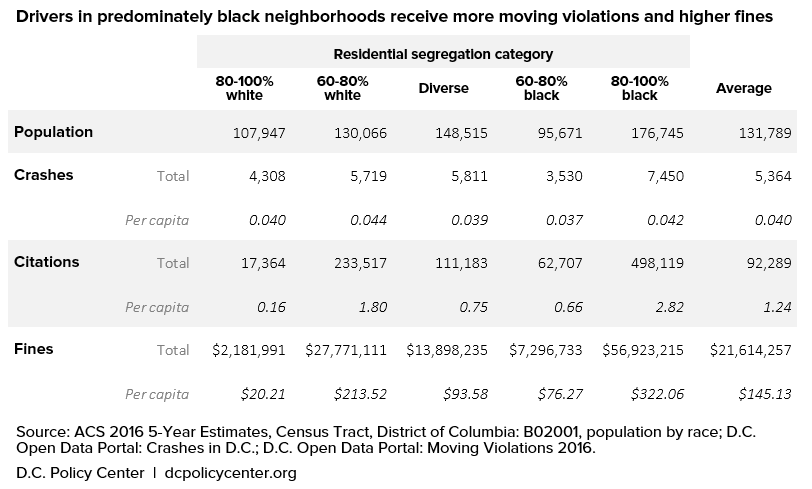
The most important result from the study is shown below:
The study reaches this conclusion by binning citation data into Census tracts, then binning those tracts into five buckets by their Black population percentage, and looking at the totals.
Descriptively, the claim is correct. The Blackest parts of DC appear to be getting outsize fines. But the “60-80% white” column is also a clear outlier, and there’s no theory offered for why racism–which is not explicitly suggested by the study, but which is being inferred by its audience–would result in that pattern.
To the study’s credit, it acknowledges that the overall effect is driven by a small number of outlier Census tracts. Here’s how they discuss it at the study’s main link:
Further inspection reveals five outlier tracts which warrant closer inspection. Four of these outliers were found in 80-100 percent black tracts while one was found in a 60-80 percent white tract. Of course, by removing these extreme values, the remaining numbers in each racial category do fall much closer to the average. But notably, the number of citations and total fines per resident within black-segregated tracts remains 29 percent and 19 percent higher than the citywide average, even after removing the outlier locations. Meanwhile, the considerably lower numbers of citations and fines within 80-100 percent white census tracts remain considerably lower than average. (For a more in-depth discussion of the results and the effect of these outliers, please see the accompanying methods post on the D.C. Policy Center’s Data Blog.)
But if you click through to that “methods post” you’ll find this table, which has been calculated without those outlier tracts. The language quoted above isn’t inaccurate. But it’s also clearly trying to conceal the truth that, with those outliers removed, the study’s impressive effect disappears.
What do we know about DC’s ATE cameras?
Let’s take a step back and look at this less reactively. What do we know about DC speed cameras?
The most useful source of data on the topic is DC’s moving violation citation data. It’s published on a monthly basis. You can find a typical month, including a description of the included data fields, here. I had previously loaded data spanning from January 2019 to April 2023 into a PostGIS instance when working on this post, so that’s the period upon which the following analysis is based.
The first important signal we have to work with is the issuing agency. When we bin citations in this way, we see two huge outliers:
ROC North and Special Ops/Traffic are enormous outliers by volume. We can be sure that these represent speed cameras by looking at violation_process_desc for these agencies’ citations: they’re all for violations related to speeding, incomplete stops, and running red lights. The stuff that ATE cameras in DC detect, in other words.
I am primarily interested in ATE’s effect on safety. The relationship between speeding and safety is very well established. The relationship between safety, red light running and stop sign violations is less well-studied. So I confined my analysis to the most clear-cut and voluminous citation codes, which account for 86% of the citations in the dataset:
 violation_code |          violation_process_desc
----------------+------------------------------------------
 T118           | SPEED UP TO TEN MPH OVER THE SPEED LIMIT
 T119           | SPEED 11-15 MPH OVER THE SPEED LIMIT
 T120           | SPEED 16-20 MPH OVER THE SPEED LIMIT
 T121           | SPEED 21-25 MPH OVER THE SPEED LIMIT
 T122           | SPEED 26-30 MPH OVER THE SPEED LIMIT
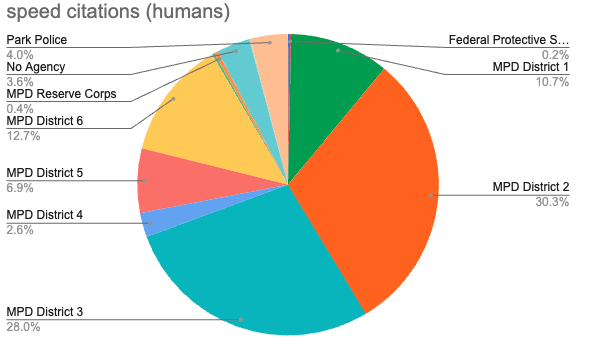
I’m not going to focus on human speed enforcement, but it is interesting to examine its breakdown by agency:
DC publishes the location of its ATE cameras, but it’s easier to get this information from the citation data than from a PDF. Each citation record includes a latitude and longitude, but it’s only specified to three decimal places. This results in each citation’s location being “snapped” to a finite set of points within DC. It looks like this:
When an ATE camera is deployed in a particular location, every citation it issues gets the same latitude/longitude pair. This lets us examine not only the number of camera locations, but the number of days that a camera was in a particular location.
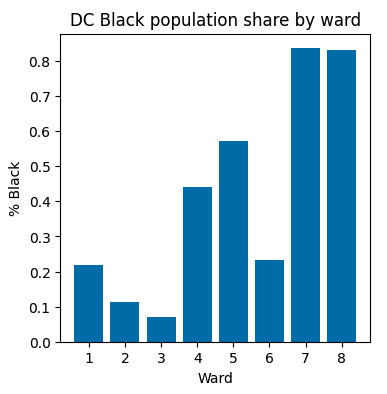
One last puzzle piece before we get started in earnest: DC’s wards. The city is divided into eight of them. And while you’d be a fool to call anything having to do with race in DC “simple”, the wards do make some kinds of equity analysis straightforward, both because they have approximately equal populations:
And because wards 7 and 8–east of the Anacostia River–are the parts of the city with the highest percentage of Black people. They’re also the city’s poorest wards.
With these facts in hand, we can start looking at the distribution and impact of the city’s ATE cameras.
Are ATE cameras being placed equitably?
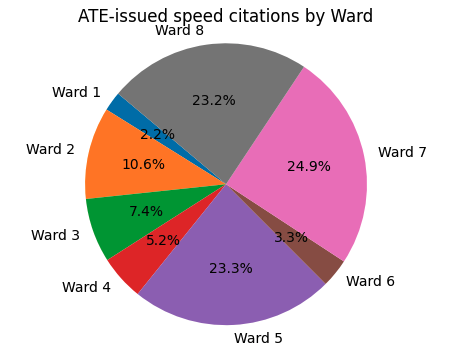
Are ATE cameras issuing citations equitably?
A high camera location:camera days ratio suggests deployment of fewer fixed cameras and more mobile cameras. A high citation:camera day ratio suggests cameras are being deployed in locations that generate more citations, on average.
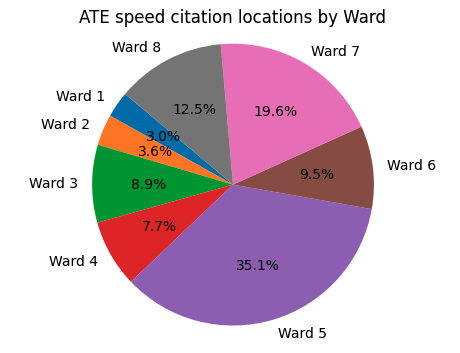
We can look at this last question in more detail, calculating a citations per camera day metric for each location and mapping it. Here’s the result:
Some of those overlapping circles should probably be combined (and made even larger!): they represent cameras with very slightly different locations that are examining traffic traveling in both directions; or stretches where mobile cameras have been moved up and down the road by small increments. Still, this is enough to be interesting.
Say, where were those DCPC study “outlier tracts” again?
Area residents will probably have already mentally categorized the largest pink circles above: they’re highways. Along the Potomac, they’re the spots where traffic from 395 and 66 enter the city. Along the Anacostia, they trace 295. In ward 5, they trace New York Avenue’s route out of the city and toward Route 50, I-95, and the BW Parkway. Other notable spots include an area near RFK Stadium where the roads are wide and empty; the often grade-separated corridor along North Capitol Street; and various locations along the 395 tunnel.
We can look at this analytically using OpenStreetMap data. Speed limit data would be nice, but it’s famously spotty in OSM. The next best thing is road class, which is defined by OSM data’s “highway” tag. This is the value that determines whether a line in the database gets drawn as a skinny gray alley or a thick red interstate. It’s not perfect–it reflects human judgments about how something should be visually represented, not an objective measurement of some underlying quality–but it’s not a bad place to start. You can find a complete explanation of the possible values for this tag here. I used these six, which are listed from the largest kind of road to the smallest:
motorway
trunk
primary
secondary
tertiary
residential
I stopped at “residential” for a reason. As described above, camera locations are snapped to a grid. That snapping means that when we ask PostGIS for the class of the nearest road for each camera location, we’ll get back some erroneous data. If you go below the “residential” class you start including alleys, and the misattribution problem becomes overwhelming.
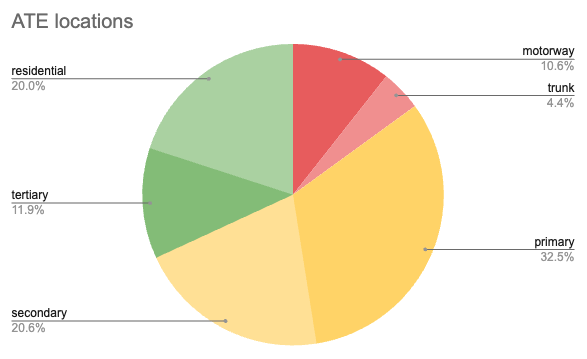
But “residential” captures what we’re interested in. When we assign each camera location to a road class, we get the following:
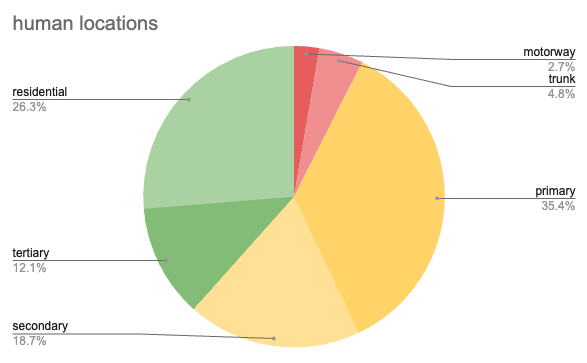
How does this compare to human-issued speed citation locations? I’m glad you asked:
The delta between these tells the tale:
ATE is disproportionately deployed on big, fast roads. And although OSM speed limit coverage isn’t great, the data we do have further validates this, showing that ATE citation locations have an average maxspeed of 33.2 mph versus 27.9 for human citations.
Keep in mind that this is for citation locations. When we look at citations per location it becomes even more obvious that road class is overwhelmingly important.
ATE is disproportionately deployed on big, fast roads. And ATE cameras deployed on big, fast roads generate disproportionately large numbers of citations.
But also: big, fast roads disproportionately carry non-local traffic. This brings into question the entire idea of analyzing ATE equity impact by examining camera-adjacent populations.
Stuff that didn’t work
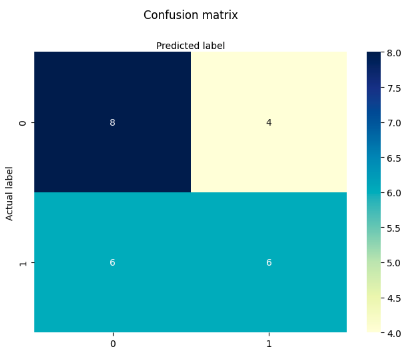
None of this is how I began my analysis. My initial plan was considerably fancier. I created a sample of human speed enforcement locations and ATE enforcement locations and constructed some independent variables to accompany each: the nearby Black population percentage; the number of crashes (of varying severity) in that location in the preceding six months; the distance to one of DC’s officially-designated injury corridors. The idea was to build a logit classifier, then look at the coefficients associated with each IV to determine their relative importance in predicting whether a location was an example of human or ATE speed enforcement.
But it didn’t work! My confusion matrix was badly befuddled; my ROC curve AUC was a dismal 0.57 (0.5 means your classifier is as good as a coin flip). I couldn’t find evidence that those variables are what determine ATE placement.
The truth is boring
Traffic cameras get put on big, fast roads where they generate a ton of citations. Score one for the braindead ATE revenue truthers, I guess?
It istrue that those big, fast roads are disproportionately in the city’s Black neighborhoods. It’s perfectly legitimate to point out the ways that highway placement and settlement patterns reflect past and present racial inequities–DC is a historically significant exemplar of it, in fact. But ATE placement is occurring in the context of that legacy, not causing it.
Besides, it’s not even clear that the drivers on those highways are themselves disproportionately Black. That’s a question worth asking, but neither I nor the DCPC study have the data necessary to answer it.
The Uncanny Efficacy of Equity Arguments
Before we leave this topic behind entirely, I want to briefly return to the idea of cognitive dissonance and its role in producing studies and narratives like the one I’ve just spent so many words and graphs trying to talk you out of.
The amazing thing about actually, that thing is racist content is that it attracts both people who dislike thatthingand want to resolve dissonance by having their antipathy validated; AND people who like the thing. Arguably, it’s more effective on that second group, because it introduces dissonance that they will be unable to resolve unless they engage with the argument. It’s such a powerful effect that I knew it was happening to me the entire time I was writing this! And yet I kept typing!
I think it’s rare for this strategy to be pursued cynically, or even deliberately. But it is an evolutionarily successful tactic for competing in an ever-more-intense attention economy. And the 2018 DCPC study debuted just as it was achieving takeoff in scholarly contexts:
None of this is to say that racism isn’t real or important. Of course it is! That’s why the tactic works. But that fact is relatively disconnected from the efficacy of the rhetorical tactic, which can often be used to pump around attention (and small amounts of money) by applying and removing dissonance regardless of whether or not there’s an underlying inequity–and without doing anything to resolve the inequity when it’s truly present.
Speed cameras are good, stop worrying about it
Speeding kills and maims people.
Speed cameras discourage speeding.
Getting tickets sucks, nobody’s a perfect driver, but ATE cameras in DC don’t cite you unless you’re going 10 mph over the limit. It’s truly not asking that much.
Please drive safely. And please don’t waste your energy feeling guilty about insisting that our neighbors drive safely, too.


 Omkhar Arasaratnam is the General Manager of the Open Source Security Foundation (OpenSSF). He is a veteran cybersecurity and technical risk management executive with more than 25 years of experience leading global organizations. Omkhar began his career as a strong supporter of open source software as a PPC64 maintainer for Gentoo and contributor to the Linux kernel, and that enthusiasm for OSS continues today. Before joining the OpenSSF, he led security and engineering organizations at financial and technology institutions, such as Google, JPMorgan Chase, Credit Suisse, Deutsche Bank, TD Bank Group, and IBM. As a seasoned technology leader, he has revolutionized the effectiveness of secure software engineering, compliance, and cybersecurity controls. He is also an accomplished author and has led contributions to many international standards. Omkhar is also a NYU Cyber Fellow Advisory Council member and a Senior Fellow with the NYU Center for Cybersecurity where he guest lectures Applied Cryptography.